
Introduction
I have a small homelab in my home that runs pfSense, Proxmox, Docker, a Synology NAS, UniFi wireless, etc… I already monitor my pfSense firewall logs using Graylog, but I was looking for a solution to monitor hardware (e.g., CPU usage, RAM usage, etc…) as well as software processes (e.g., containers using network, current download/upload speed, etc…).
I stumbled upon two separate software stacks for this. First is the TICK stack, which is composed of open-source products from InfluxData:
- Telegraf - collect and send metrics
- InfluxDB - database to store metrics
- Chronograf - graph metrics
- Kapacitor - alerting based on metrics
Second is the TIG stack:
Ultimately, I chose the TIG stack because Grafana can handle more data sources than Chronograf (e.g., ElasticSearch, Prometheus, SQL, etc…). I setup my TIG stack pretty easily, and Grafana has a marketplace where users can upload dashboards, so I was able to quickly find some working examples.
However, to monitor my homelab, I needed to be logged into Grafana, which would distract from my primary display. Instead, I wanted a separate display with a mini-version of the Network Operations Center from somewhere like NASA or Akamai.
Hardware setup
For this setup, I purchased the following hardware:
- Raspberry Pi - $35.00 (I had a 3B+ lying around from a kit)
- MicroSD card - $5.79
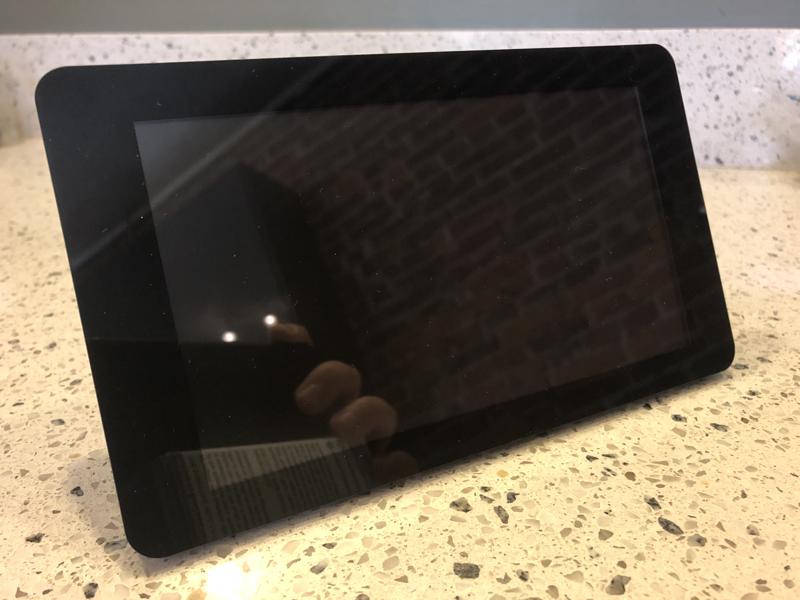
- Raspberry Pi 7" Touchscreen Display - $61
- Pibow Touchscreen Frame - $12.20
Be warned, however, the power supply with my kit was giving me the Under-voltage detected! warning. I will eventually upgrade to the official Raspberry Pi Universal Power Supply and a dual microB USB power cable.
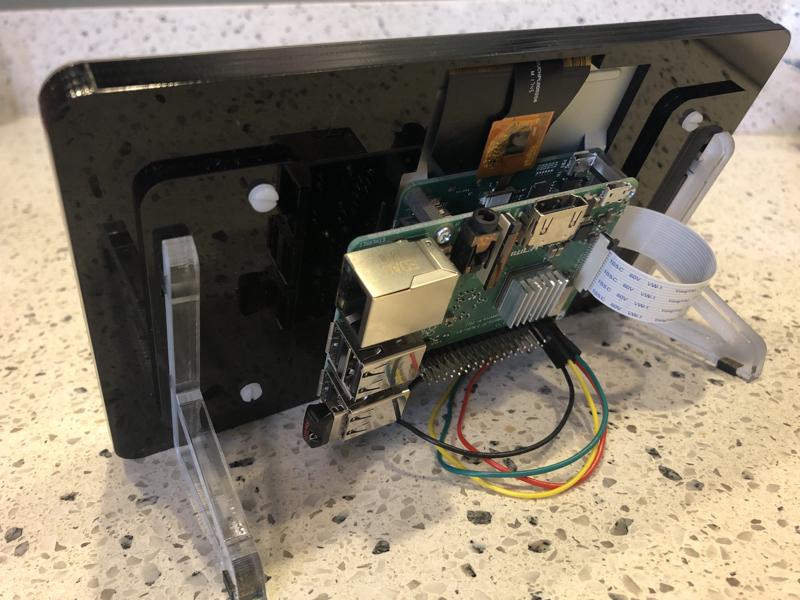
The assembly was pretty easy:
- Remove the display from the package (leave the protective film on for now)
- Follow these instructions to install the display in the Pibow frame
- Follow these instructions to attach the Raspberry Pi to the display
Raspbian setup
Raspbian
Because I’m using the official Raspberry Pi touchscreen, I wanted to use Raspbian to ensure the touchscreen would work properly (e.g., drivers, calibration, etc…). Because the Raspberry Pi is limited on both memory and storage space, I always prefer to use Raspbian Lite and then add a desktop, as opposed to using Raspbian Desktop and then stripping out unneeded packages (e.g., LibreOffice, Wolfram, Sonic Pi, Scratch, etc…).
I won’t cover how to install Raspbian to a SD card, since the Raspberry Pi Foundation already has a pretty good guide on their site. I’ll be assuming you have already:
- Installed Raspbian and have it booted properly (you can login via SSH, or a local keyboard/mouse)
- Used
sudo raspi-configto- Expand the filesystem
- Set the hostname
- Set the locale
- Setup a network connection or WiFi
- Set boot mode to
Desktop Autologin
Screen rotation
My screen was upside-down on the initial boot. Use the command below to rotate both the screen and touch input 180°.
echo "lcd_rotate=2" | sudo tee -a /boot/config.txt
sudo reboot
Here is the boot process (ignore my bad GIF-making skills, the bright spot on the screen is a light in my kitchen).
Desktop installation
First, make sure you’re up-to-date with all packages.
sudo apt update && sudo apt dist-upgrade && sudo apt autoclean
Next, install the X Window server.
sudo apt install --no-install-recommends xserver-xorg xinit
Next, install the LXDE desktop. This will pull in all the required dependencies.
sudo apt install --no-install-recommends task-lxde-desktop lxappearance lxsession raspberrypi-ui-mods rpd-icons unclutter
Now, reboot the Pi and you should see it boot up and auto-login to a desktop.
Browser installation
We need a browser that supports launching a web page automatically, at fullscreen, with no other controls on the page (this is commonly called kiosk-mode). For a long time, only Chromium had this, but Mozilla finally fixed an 11yr old request and added kiosk mode in Firefox 71. Unfortunately, Firefox on the Raspberry Pi is using the Extended Support Release (ESR) version, which is stuck at 68.8.0 (as-of this writing), so we need to install Chromium.
sudo apt install chromium-browser
Grafana setup
Grafana server
Because there an a million ways to setup Grafana, I’m going to assume you already have the following things setup:
- A Grafana instance (mine is running on a separate Docker server hosted internally at https://grafana.mydomain.com)
- One or more dashboards
- A playlist (allows you to auto-cycle through dashboards)
- A user that is not admin (the username/password will be stored on the Raspberry Pi in plain-text)
- The viewer role setup for that user (so this user will be view-only)
Grafana kiosk mode
Conveniently, Grafana provides an official tool to run Grafana in kiosk mode called Grafana Kiosk. This tool will use Chromium to login to Grafana and display a dashboard/playlist (as well as control LXDE) on a local or remote Grafana instance.
Start by downloading Grafana Kiosk. As-of this writing, it is currently at version 1.0.1, but check for updates and substitute the version number as needed. The commands below will place the executables (for all architectures) in ~/grafana-kiosk/bin.
cd ~
wget https://github.com/grafana/grafana-kiosk/releases/download/v1.0.1/grafana-kiosk-1.0.1.zip
unzip grafana-kiosk-1.0.1.zip && rm grafana-kiosk-1.0.1.zip
Next, you need to determine the architecture of your CPU. Run the command below on your Raspberry Pi.
lscpu | grep Architecture
My Raspberry Pi is a 3B+, so my architecture is armv7l., which means my executable will be ~/grafana-kiosk/bin/grafana-kiosk.linux.armv7.
Autostart
I tried using the session-based startup method, but it wasn’t working. For me, the easiest way was to use systemd startup and place a slight pause in the startup (without it, I was getting errors about the display not being ready).
First, create the new systemd service file.
sudo touch /etc/systemd/system/grafana-kiosk.service
sudo chmod 600 /etc/systemd/system/grafana-kiosk.service
Run the command below to create the new service. Replace the user’s path (in two places), the URL, the username, and the password as needed.
sudo bash -c 'cat << 'EOF' > /etc/systemd/system/grafana-kiosk.service
[Unit]
Description=Grafana Kiosk
Documentation=https://github.com/grafana/grafana-kiosk
Documentation=https://grafana.com/blog/2019/05/02/grafana-tutorial-how-to-create-kiosks-to-display-dashboards-on-a-tv
After=network.target

[Service]
User=logan
Environment="DISPLAY=:0"
Environment="XAUTHORITY=/home/pi/.Xauthority"
ExecStartPre=/bin/sleep 30
ExecStart=/home/pi/grafana-kiosk/bin/grafana-kiosk.linux.armv7 -URL https://grafana.mydomain.com/playlists/play/1 -login-method local -username username_here -password password_here -playlist true -lxde

[Install]
WantedBy=graphical.target
EOF'
Reload systemd and then start the service. After sleeping for 30 seconds, Grafana should start.
sudo systemctl daemon-reload
sudo systemctl enable grafana-kiosk
sudo systemctl start grafana-kiosk
sudo systemctl status grafana-kiosk
If you have any issues, use the command below to look at the logs.
journalctl -u grafana-kiosk
Here is my completed display with my first dashboard loading (ignore my bad GIF-making skills, the bright spot on the screen is a light in my kitchen).
Timed display control
You can also configure the display settings using cron. For example, I have setup a pair of cronjobs to turn the display off and on at specific times (e.g., off at 11pm, on at 7am), as well as another job to set the brightness. This should be added under root’s crontab.
#Crontab Schedule
# +---------------- minute        (0 - 59)  *=all
# |  +------------- hour          (0 - 23)  *=all
# |  |  +---------- day of month  (1 - 31)  *=all
# |  |  |  +------- month         (1 - 12)  *=all
# |  |  |  |  +---- day of week   (0 - 6)   *=all
# |  |  |  |  |
# *  *  *  *  * command to be executed
# -- -- -- -- - ---------------------------------
# 00 12 *  *  * some_command      # will run some_command at 12:00 (noon) daily
##============================================================================
#Turn display off at 11pm every day
0 23 * * * echo 1 > /sys/class/backlight/rpi_backlight/bl_power

#Turn display on at 7am every day
0 7 * * * echo 0 > /sys/class/backlight/rpi_backlight/bl_power

#Set the display brightness on every reboot
#Choose a value between 0 (min) and 255 (max)
@reboot echo 75 > /sys/class/backlight/rpi_backlight/brightness
Conclusion
I’ve had this running for the past few days without issue. My only complaint is that the screen resolution is only 800x480, so the dashboards are pretty small. Looking around, there a number of larger displays available, but I could also use a spare monitor connected via HDMI.
Thanks for reading!
-Logan
